Every pattern drawn. And where it points.
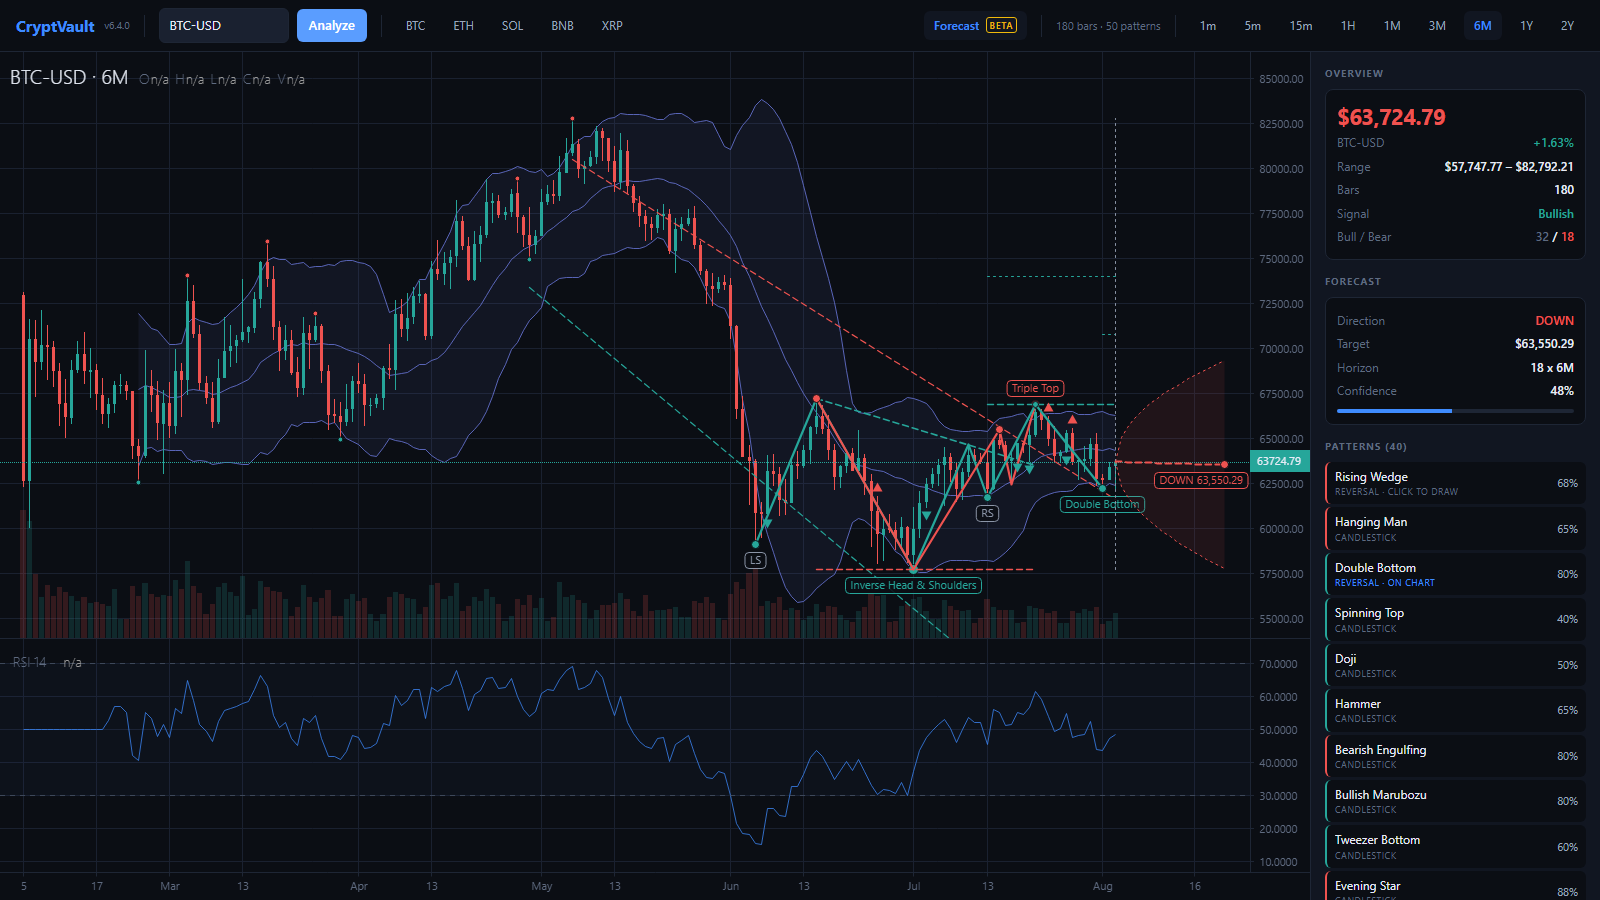
Most libraries tell you a Head & Shoulders exists and hand you a bar index. CryptVault computes the geometry — shoulders, armpits, the sloped neckline — draws it onto live candles, and carries it past the last bar to the measured target. Nothing is listed that cannot be shown.
Geometry is computed in Python. The browser only paints it.
Pattern maths lives next to pattern detection, not in a rendering layer. The chart
receives a flat list of primitives in [timestamp, price] space, so a
diagram stays welded to the candles through any pan or zoom.
Fetch
Live candles from the Hyperliquid venue, Yahoo for everything else.
Detect
Every detector runs and returns pivot indices in an extra payload.
Snap
Pivots move to the true swing high or low within ±2 bars, so lines touch the wicks.
Emit
shapes.build() returns primitives tagged with the pattern they belong to.
Paint
One trading-vue overlay maps time and price to screen and strokes the canvas.
Every family gets its own construction.
These figures are not illustrations. Each one is rendered from the output of
cryptvault.desktop.shapes — the same function the desktop chart calls.
Four primitives, and no JavaScript to add a pattern.
Because the renderer only understands four shapes, teaching CryptVault a new diagram means writing a Python function that returns them. Nothing in the browser changes.
| Primitive | Draws |
|---|---|
| poly | Polyline, optionally dashed and filled |
| dot | Pivot marker |
| text | Boxed label, nudged clear of its neighbours |
| mark | Triangle pointing at a bar |
- Grouped. Every primitive is tagged
name@bar, so two detections of the same pattern stay separate. - Stackable. A few draw on load; click any pattern to add its diagram and scroll to it, click again to drop it.
- Resilient. A malformed pivot payload falls back to bracketing the candles, never raises — a bad pattern cannot blank the chart.
- Projected. The same four primitives carry a pattern past the last bar: its trigger level, the measured move, the target and the stop — dashed, always, so a hypothesis never looks like history.
# cryptvault/desktop/shapes.py
def _head_shoulders(f, extra, idx, color, inverse, name):
    ls, head, rs = extra["ls"], extra["head"], extra["rs"]
    pick    = f.trough if inverse else f.peak
    between = f.ridge_between if inverse else f.valley_between

    p_ls, p_h, p_rs = pick(ls), pick(head), pick(rs)
    n1, n2 = between(ls, head), between(head, rs)

    # the neckline slopes through both armpits
    slope = (n2[1] - n1[1]) / (n2[0] - n1[0])

    return [
        _poly([p_ls, n1, p_h, n2, p_rs], color, 2.2),
        _poly([n1, [t_end, neck_end]], color, 1.6, DASH),
        _dot(p_ls, color), _dot(p_h, color, 5.0), _dot(p_rs, color),
        _text(p_ls, "LS", NEUTRAL), _text(p_rs, "RS", NEUTRAL),
    ]
The last bar is the one still forming.
Candles come from the Hyperliquid public endpoint — the venue the price is formed on, not a delayed vendor copy. The chart polls the mid every few seconds and rescans for patterns in the background, without moving the view out from under whatever you are reading.
- Pattern targets. Any measured move draws its trigger level carried past the last bar, the path to target, and the stop — placed as far ahead as the pattern took to form.
- Forming patterns. Structures that have not completed are detected separately and drawn with their missing pivots projected: a right shoulder that has not printed, the second peak of a double top, or the apex a triangle is converging on.
- Both outcomes. A pending apex has no direction yet, so both breakout legs are drawn and measured. One arrow would be a claim the data cannot support.
# what a forming pattern carries
{
  "name":   "Head & Shoulders (forming)",
  "have":   [[412, 63750.0], [430, 62100.0], [448, 65200.0]],
  "future": [[484, 63750.0]],   # the shoulder still to come
  "level":  62100.0,             # neckline
  "target": 59000.0
}

# `have` draws solid. `future` draws dashed.
# The viewer never has to guess which is which.
A local page, a stdlib server, no build step.
python launch_desktop.py starts an http.server on
127.0.0.1 and opens a native window if pywebview is installed, your
browser otherwise. A live market rail, one authoritative price readout, and a
pattern panel grouped by category. Charts render with
trading-vue-js; Vue and the
chart bundle are pinned and cached on first launch, so the interface runs offline
afterwards. No Electron, no npm.
Three commands to a chart.
Python 3.9 or newer. Add pip install pywebview for a native window
instead of a browser tab.
git clone https://github.com/MeridianAlgo/Cryptvault.git
cd Cryptvault
pip install -r requirements.txt

# desktop terminal
python launch_desktop.py

# or the command line
python cryptvault_cli.py BTC 90 1d
- Seven timeframes from 1-minute bars to weekly, every label a bar interval.
- 70+ patterns across forming, reversal, continuation, candlestick, harmonic and divergence families.
- ML ensemble at 1.6–2.4% MAPE on major pairs, weighted by rolling out-of-fold validation.
- Python API and CLI for portfolio analysis, comparison and batch runs.